Insight Focus
Sugar consumption growth has slowed since the 2010s. We break down the reasons why and show what could happen in the future. This speech was first given at the Dubai Sugar Conference 2023.
Time for something a little different. Last week I travelled to Dubai to speak on sugar consumption at the 2023 Dubai Sugar Conference.
Gareth Forber of LMC had already spoken about the state of the world’s sugar taxes when I stood up to cover sugar consumption more broadly.
As well as taxation, I spoke about population growth, incomes, consumer trends, reformulation and so on.
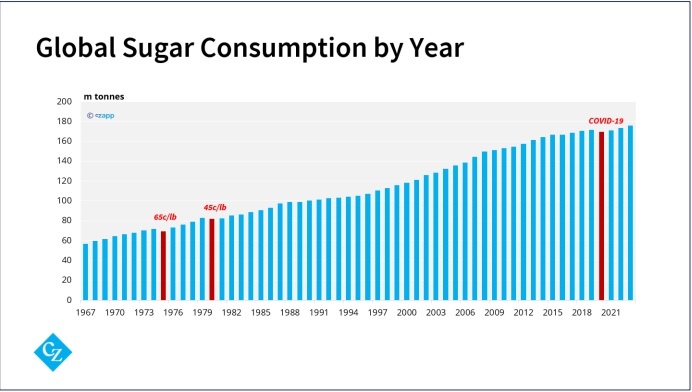
Let’s start with some history. In most of our lifetimes, global sugar consumption has only grown. There have been 3 years this hasn’t happened: 1975 and 1980 when sugar prices went nuts, and 2020 when COVID meant life went nuts. The big question for today is whether we will see a fourth event, or more, in the future.
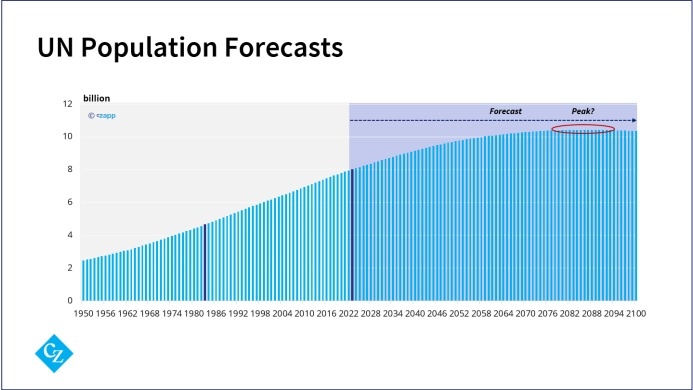
Let’s start with population. Almost everyone on the planet eats sugar. More people means more consumption. Today there are 8 billion people on the planet; when I was born it was only 4 and a half billion. This has been an enormous help for global sugar consumption.
This century the world’s population will probably peak. Maybe not in my lifetime, but possibly in my son’s lifetime. The UN thinks the world’s population will reach at 10.4 billion people in the mid-2080s. Let’s assume this forecast is true. This means that the base level for sugar consumption growth for the next 60 years is going to be less than 1% a year.
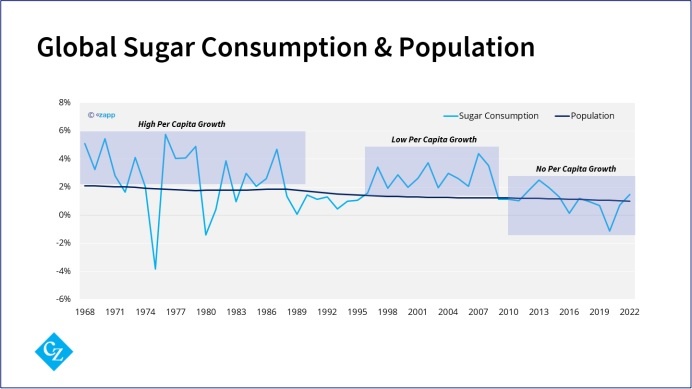
This is already a challenge for us. In the 1970s and 1980s, population grew at 2% a year but sugar consumption grew at around 3% a year. Following the collapse of the Soviet Union sugar consumption fell to 1% a year for most of the 1990s before rebounding to 3% a year again during the 2000s commodity boom. But since the 2010s we’ve been stuck at 1% growth again and population isn’t really going to help us improve this.
What might? Let’s look at wealth and politics. If people are wealthier, they tend to eat more sugar. This happens from quite a low level – sugar is cheap and nice to eat, it also acts as a preservative.
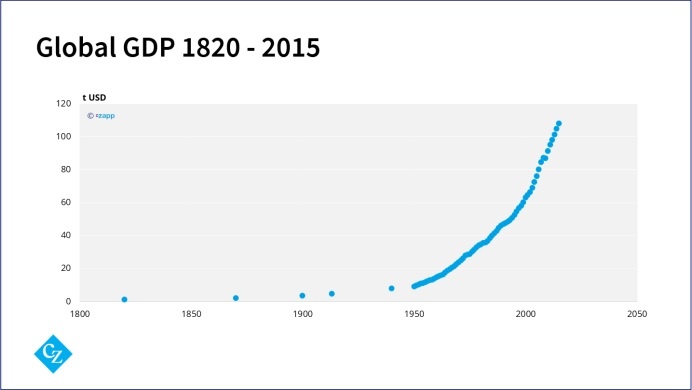
Here’s a chart of global GDP by year since around 1820, in 2011 Dollars. We’ve come a long way.

Consider that in the early 1700s St Paul’s cathedral was rebuilt in London and Sir Christopher Wren decorated the top of the clock towers with statues of pineapples, at the time a symbol of great wealth. Today I can go to my local shop and buy one for about a Dollar.
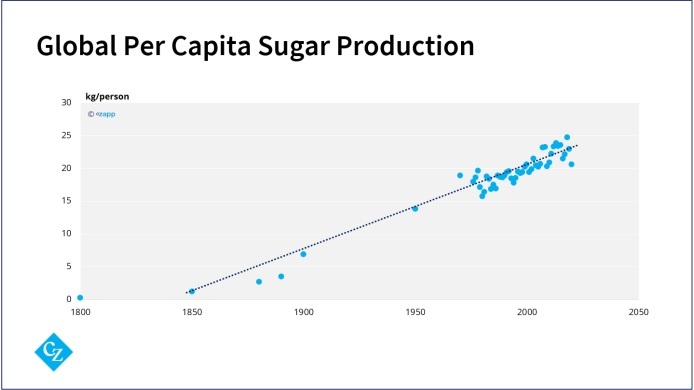
Here’s how global per capita sugar production looks in the same time frame. I’ve had to use production rather than consumption because that’s the best data I have. But they should be quite closely aligned. It’s a pretty nice uptrend which has held for more than one hundred years, and today the world makes around 20 to 25 kilos of sugar per person per year.
I’m going to assume the world continues to get wealthier in the future because the alternative isn’t fun to think about. This should mean that sugar consumption continues to rise thanks to wealth. But it’s not so easy. We have to also include geopolitics.
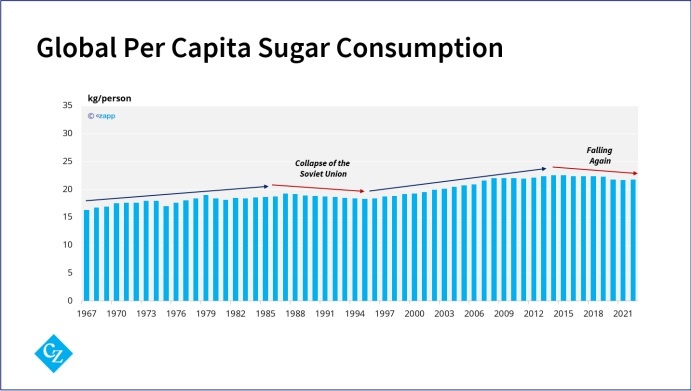
Remember the case of the 1990s, after the collapse of the Soviet Union? During this time global per capita sugar consumption actually fell. Even though the world was getting richer in aggregate, when a major part of the world is in turmoil this can negatively affect sugar consumption growth.
This is important today because it feels like globalization is going into reverse. Today, Russia isn’t supplying energy to Europe – in fact, the US and EU are applying sanctions to Russia, Iran and Venezuela, who are all major energy producers. The US and China have had trade wars over agricultural goods and semiconductors, and we have a real war in Europe. I hope the world keeps getting richer, but I suspect this wealth will be unevenly distributed and not as easy as the last 30 years. This matters for sugar consumption.
What this means for each country depends on the country in question. It’s really hard to generalize when it comes to sugar consumption. Everywhere is slightly different. Perhaps the best way to think about it is to split countries into 2 groups: those where there’s a high proportion of tabletop sugar usage versus those where most sugar is consumed in processed foods and drinks. I think they have two quite different responses to economic downturns.
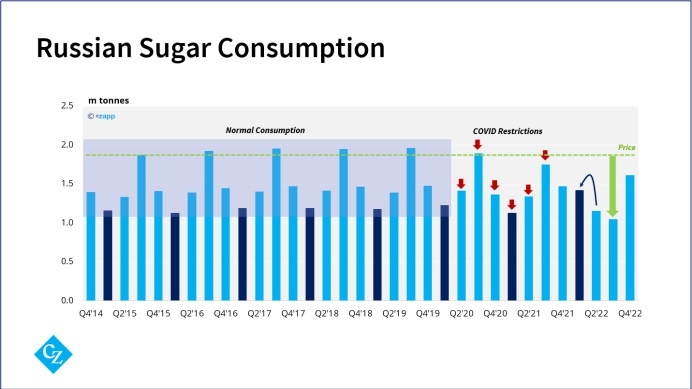
In countries with a high proportion of household or tabletop use, consumers tend to be aware of the price of sugar. Its affordability and availability matters. If it becomes too expensive, people will cut back and run down their stocks. We can see this even in quite urbanized countries like Russia, which I accept has had a strange few years. Here’s quarterly sugar consumption, which was quite regular from 2015 to 2019.
2020 and 2021 sugar consumption were slightly lower and may have been hit by covid restrictions.
But 2022 was different. In February Russia invaded Ukraine and you can see Q1 sugar consumption was much higher than normal. This was probably consumers stocking due to the outbreak of war….you can see that Q2 demand was lower than normal but the first half of the year in aggregate was normal. But by Q3 consumption had collapsed. This coincided with prices spiking from around $600 per tonne to $1,200.
In countries where most sugar consumption is in processed foods, we don’t see much change from higher prices of sugar or economic downturns. In fact, because sugar is a cheap ingredient compared to others, the proportion of sugar in foods sometimes increases when company margins are squeezed.
Here’s a long-term look at UK per capita sugar consumption with post-war recessions labelled in blue.
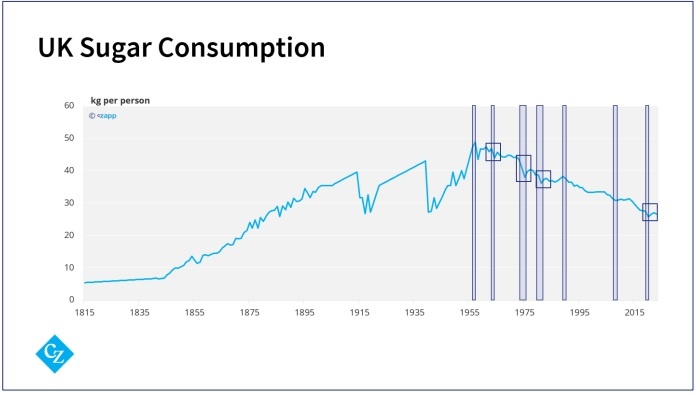
At most you can see the downtrend in sugar consumption accelerates during a recession, before moving back on trend afterwards. It looks like the pipeline stocks are squeezed when times are tight, then replenished later on. This is true even in the time of very high sugar prices in 1975 and 1980.
Now, I showed earlier that global sugar consumption was around 20-25 kilos per person per year. Can increasing wealth boost it beyond this level? I think it’s going to be difficult if globalization reverses. We’ll need gains in middle income and lower income countries to offset declines in higher income countries. As you all probably know, many countries’ sugar consumption is in reverse.
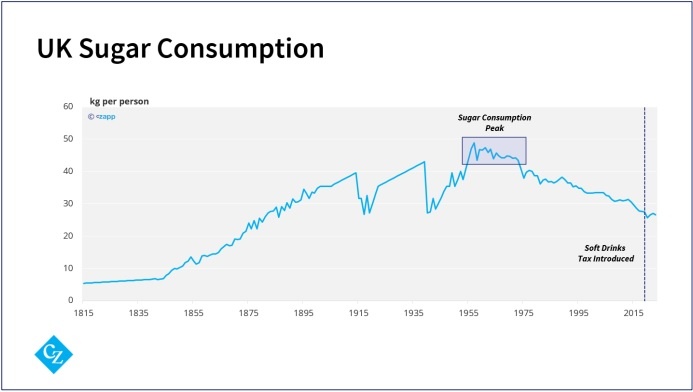
In the UK we think sugar consumption peaked in the 1960s. I think our friends at Green Pool have shown that sugar consumption in Australia peaked at a similar time.
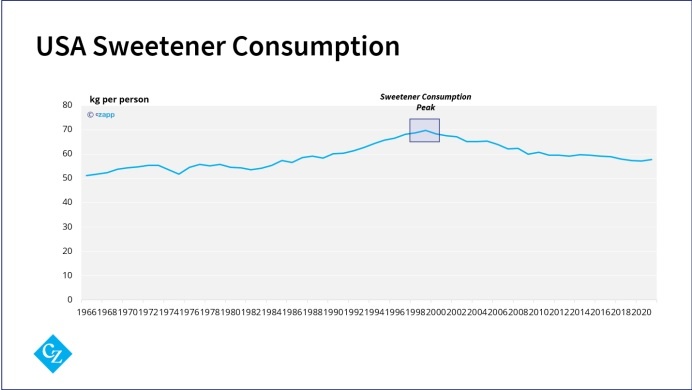
In the USA calorific sweetener consumption peaked in 1999.
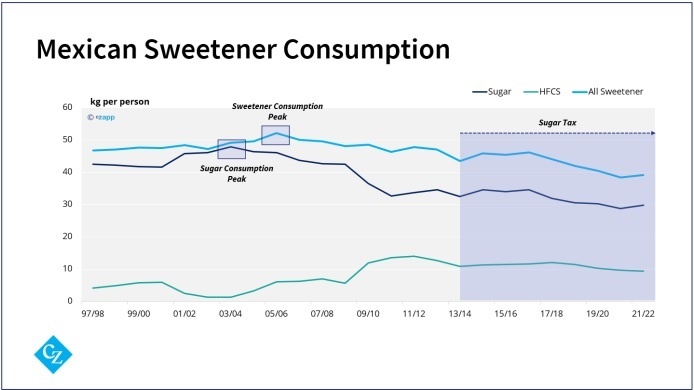
In Mexico, calorific sweetener consumption peaked in 2005.
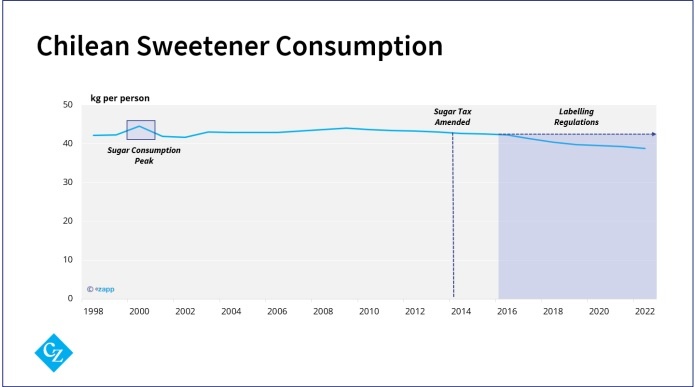
Time and again we find this trend, and it’s been happening for longer than you’d imagine.
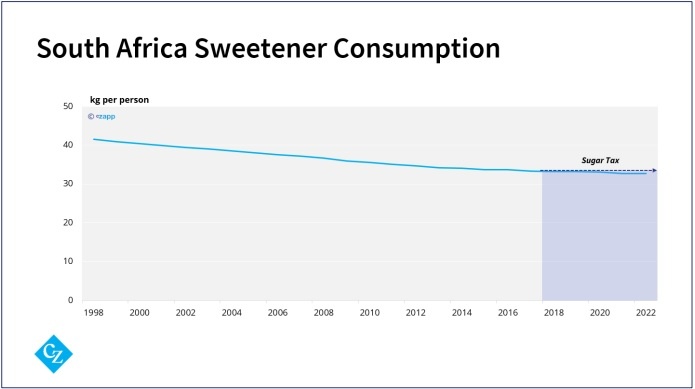
There’s a limit to how much sugar people can consume, and in time people seem to start restricting their intake.
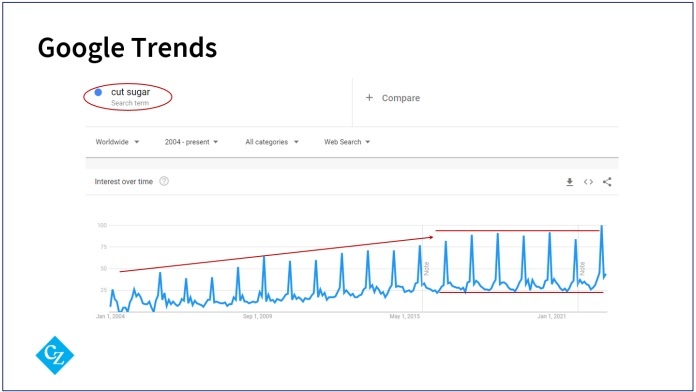
We first really noticed this in the 2010s, when the world seemed to wake up to sugar. For decades fat had been vilified. But in the 2010s, sugar became the target.
At the very least people became more aware of the amount of sugar they were eating, and being aware makes it easier to reduce.
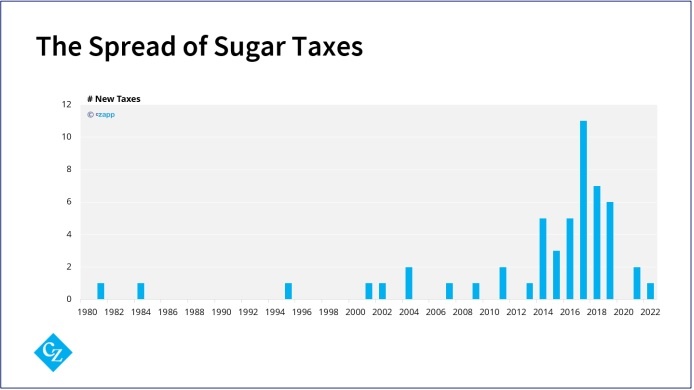
It was around this time we saw the barrage of sugar taxes being enforced around the world, often with a lot of marketing, further raising awareness. Gareth has already mentioned taxation and how they’re most effective when they drive reformulation.
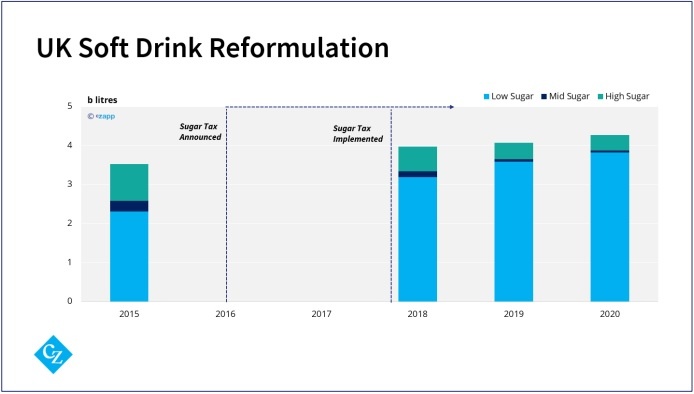
With soft drinks it’s easy. Sugar adds sweetness and not much else. Sweetness can be replicated through a combination of other sweeteners. You can see in the UK that before the sugar tax was announced low sugar soft drinks were already dominant, but the pace of reformulation was fast once the tax had been applied.
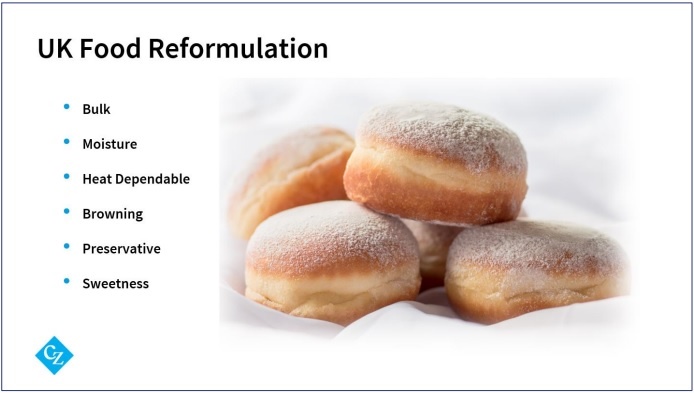
It’s harder to reformulate many other foods. It’s really hard to take sugar out of things like doughnuts or cakes or biscuits and for them to still appeal to consumers and be cheap.
There’s no point in reformulating food to make it healthier if people don’t eat it. The food still has to taste nice. People tend to choose to eat things that they like.
The country for which we have the best data on this is the United Kingdom. In 2016 the UK government asked food manufacturers to try to reduce the sugar content of the foods most likely to be consumed by children by 20% by 2020. I say asked, I think the implication was that they should volunteer to do it or be forced to do it by law. The government hoped that the sugar could be removed without consumers noticing and so sugar consumption would drop without people having to change their diets. Here are the results.
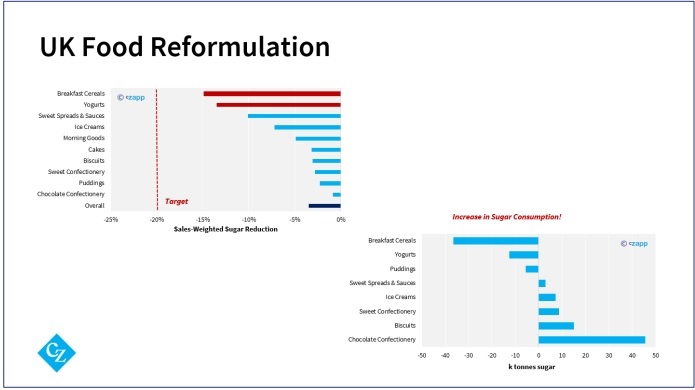
By 2020, the UK’s food manufacturers managed to reduce sugar content by just 3.5% across all categories on a sales weighted basis. This was far below the government’s 20% target.
The products that were easiest to reformulate (breakfast cereals and yogurt) showed the largest reductions. There was almost no sugar reduction in cakes, biscuits, sweet confectionery, puddings and chocolates. I mean….good luck taking sugar out of a boiled sweet.
These changes meant that the amount of sugar sold in these products actually rose 7.1% to 2020. The 2020 figures might have been skewed by COVID, but sugar consumed in these products in 2019 was 2% higher than in 2015. This is roughly aligned with UK population growth. In other words, there was no change in UK per capita sugar intake thanks to reformulation.
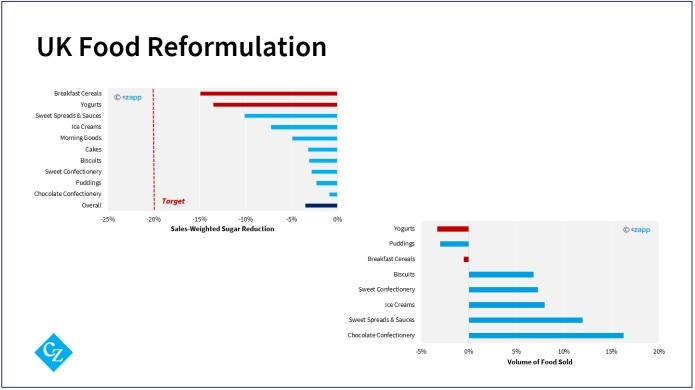
Why was this? The total volume of food sold in these categories rose from 2.8m tonnes in 2015 to 2.9m tonnes in 2019. Sales to 2019 fell in three categories: breakfast cereals, yogurts and puddings. You’ll notice that two of these categories had seen the biggest reductions in sugar content through reformulation. Speaking bluntly, consumers in the UK bought more of the foods which hadn’t been heavily reformulated, and less of those where the sugar reductions had been the greatest. Reformulation has led to people eating less cereal and yogurt, and more chocolate. Remember: people choose to eat things that taste nice.
Let’s put this all together and try to get to some sort of conclusion. The world consumes around 175m tonnes of sugar a year at the moment. Population growth will help drive consumption higher, but we can’t necessarily depend on increasing income, plus consumers are more aware of sugar intake, though this sometimes works in our favour because they also like eating nice foods. Many countries’ sugar consumption is also in decline.
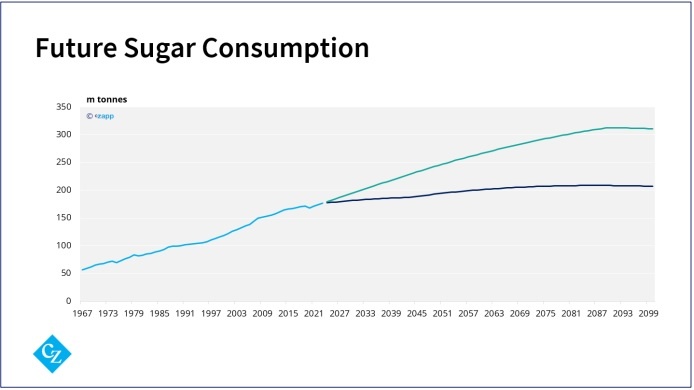
Bear in mind that the world health organisation recommends that no more than 10% of adult calories come from free sugars. That’s around 20 kilos per year in round numbers. If we end up here in this century,consumption should peak in the mid-2080s at just 210m tonnes. In 2018 the world made 190m tonnes of sugar, so we wouldn’t need to add much more sugar production to meet this.
If the UK’s current consumption of around 30 kilos per person per year is more representative, consumption might peak in the 2080s at 310m. The reality is probably going to be somewhere between these two scenarios. I’ll leave it to each of you to decide where in this range you think is most likely.
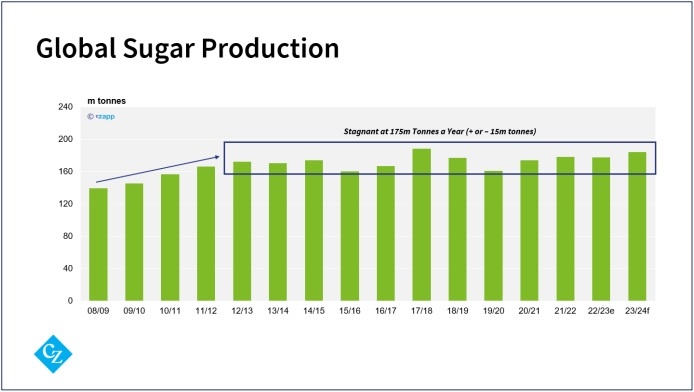
If you think sugar consumption is going to 300m tonnes this century, then you need to consider the investment we need to make this happen. Global production has stagnated at 175m tonnes a year for more than a decade. This means we’d need huge investment in areas able to efficiently grow cane and beet.
If you think that sugar consumption is going to 210m tonnes this century, then you need to consider what a viable future for the sugar industry looks like.
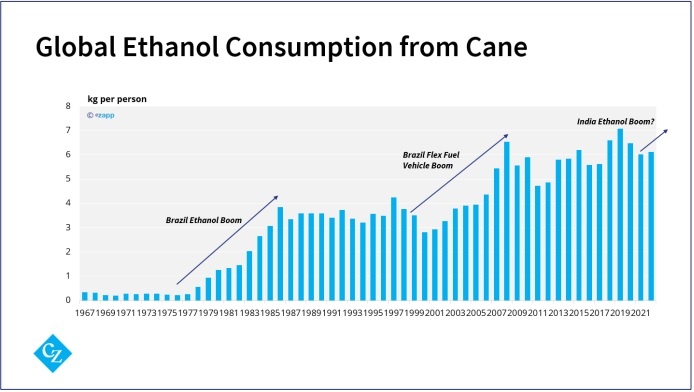
You don’t need me to tell you that India is reshaping the sugar market by making ethanol to blend into gasoline. This is giving us a third wave of growth in cane-based ethanol. Will the fourth be India’s move to flex-fuel vehicles? Or will another country step up?
Think carefully about what sugar consumption you are assuming in your investment decisions in the years ahead. Do they line up with what you believe? The world will still need food and energy in the future. The opportunity for our sector is huge.
For more articles, insight and price information on all things related related to food and beverages visit Czapp.


