S&D and Trade Flow
The sentiment in the sugar market has shifted toward a more supportive outlook. Since April, production estimates for the Center-South region have been downgraded due to adverse weather conditions and occurrences of fires. Although the Northern Hemisphere is anticipated to rebound, its production will still fall short of historical levels. Trade flows are expected to experience significant pressure between Q4 2024 and Q1 2025, contributing to a bullish trend in the short to medium term.
As the Northern Hemisphere’s harvest begins, the availability of white sugar should increase, exerting downward pressure on the white premium. This situation is particularly challenging for tolling refineries, especially given the longer and harsher intercrop period in the Center-South region, which adds to the possibility of a higher raw price. Brazil is projected to produce around 610 Mt of cane and approximately 39.8 Mt of sugar, while Europe, Central America and Thailand are expected to contribute more with the international market.
With India’s sugar exports estimated at 1.5 Mt, given favorable parity, the risks appear to be more on the bullish than on the bearish side of the equation. Since sugar exports are subject to political decisions by the Indian government, there may be reluctance to grant quotas if stockpiling does not occur rapidly enough, possibly increasing the short-medium term deficit. Meanwhile, discussions about Brazil’s 2025/26 season are beginning, and the outlook is not encouraging. Therefore, although somewhat balanced for the year, considering the sum between Q4/24 and Q3/25, risks are of reducing availability.
Currently, there are several issues affecting the development of Center-South’s 25/26 season: fires have impacted the region, soil moisture levels are low, and planting has faced delays, but summer rainfall will be a critical factor. Consequently, we’ve revised our initial “educated guess” from 620 Mt to 600 Mt, which still hinges on summer rains. This revision implies a reduced bearish influence starting from Q2 2025, compared to our previous estimates, indicating a higher price range and a lower correction as the next season approaches.
Total Trade Flow (‘000t)

Source: Hedgepoint
Raw’s Trade Flow (‘000t)

Source: Hedgepoint
White’s Trade Flow (‘000t)

Source: Hedgepoint
Global Supply and Demand Balance (MT RV oct-sep)

Source: Hedgepoint
Brazil CS
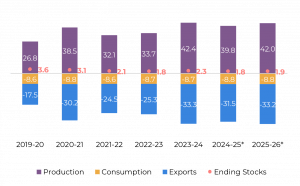
Sugar Balance – Brazil CS (Apr-Mar Mt)
Source: Unica, MAPA, SECEX, Hedgepoint
By the end of September, Center-South cane volume has already surpassed 505 Mt, indicating a strong likelihood of meeting our 610 Mt forecast by the end of the 24/25 season. Total Recoverable Sugar (TRS) levels have been exceptionally high in recent fortnights due to dry weather; however, the quality has not been optimal. A higher concentration of reducing sugars has hindered mills from achieving the desired mix levels, keeping it below 48%. Consequently, we have adjusted our end-of-season mix estimate to 48.2%. Paired with a TRS of 142 kg/t, this adjustment suggests a total sugar output of 39.8 Mt. As a result, Center-South could export 31.5 Mt of the sweetener this season, with 18.7 Mt already shipped by September.
For the upcoming season (25/26), rainfall during the summer will be a critical factor. While we wait, some factors are clear: fires have affected the region, though the extent is difficult to measure; soil moisture remains low; and planting has experienced delays. The situation resembles the 16/17 season, which also suffered from an El Niño occurrence, with planting delays but somewhat higher soil moisture.
With INMET forecasting improved summer rains for much of the cane-producing regions, we have revised our initial projection from 620 Mt down to 600 Mt, still above the market average. With no changes to our mix estimate (51.9%) or TRS (141.7 kg/t), Center-South could reach 42 Mt of the sweetener, with potential exports close to 33 Mt. Further revisions will follow, particularly once summer rainfall data becomes available. However, this change has already impacted our trade flows, reducing the surplus expected once the region starts the new season.
Total Exports – Brazil CS (‘000t)

Source: SECEX, Williams, Hedgepoint
Total Stocks – Brazil CS (‘000t)

Source: Unica, MAPA, SECEX, Williams, Hedgepoint
Brazil CS Ethanol
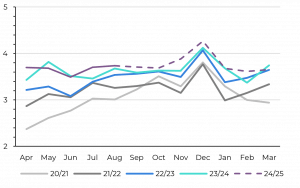
Otto Cycle – Brazil CS (M m³)
Source: ANP, Bloomberg, Hedgepoint
The Otto Cycle in the Center-South region has performed as expected, aligning with our projected 2.6% growth rate for the 2024/25 crop year. As noted in previous reports, drought conditions and recent fires in the region have made it difficult for mills to achieve their desired sugar mix levels. This has resulted in higher-than-anticipated ethanol production, providing some relief to stock levels. Consequently, ethanol prices have remained bearish, lagging behind sugar prices.
However, in states like Paraná and Minas Gerais, pump parity has risen to around 68%, where shifts in consumer preference between ethanol and its fossil fuel alternative are already visible – although energetic equivalence lingers between 70 and 73%. Notably, Unica’s latest report highlighted strong anhydrous domestic sales. Despite this, the growth in hydrous sales remains impressive, with a volume up over 30% year-on-year throughout the season.
Anhydrous Ending Stocks – Brazil CS (‘000 m³)

Source: Unica, MAPA, ANP, SECEX, Hedgepoint
Hydrous Ending Stocks – Brazil CS (‘000 m³)

Source: Unica, MAPA, ANP, SECEX, Hedgepoint
Brazil NNE
Sugar Balance – Brazil NNE (Apr-Mar Mt)

Source: MAPA, SECEX, Hedgepoint
The North-Northeast (NNE) region is on track for another strong year. For the 2024/25 season, cane production is expected to reach at least 63 million metric tons (Mt). However, recent rainfall may impact total recoverable sugar (TRS), which is now projected to remain below 2023/24 levels at 125 kg/ton. With a higher sugar mix, around 50%, the region should produce 3.8 Mt of sugar.
By the end of September, data from Brazil’s Ministry of Agriculture (MAPA) shows that the NNE region had already produced 738 thousand tons of sugar, 24% higher than the 596 thousand tons produced by the same time in 2023/24. In terms of biofuels, the region has produced 631 million liters during the period between April and September, compared to 1.1 billion liters the season prior, a direct impact of a higher sugar mix. Coupled with an increasing fuel consumption, the need to transfer product from Center-South to NNE might be higher during the intercrop.
Total Exports – Brazil NNE (‘000t)

Source: SECEX, Hedgepoint
India
Sugar Balance – India (Oct-Sep Mt)

Source: ISMA, Hedgepoint and Indian trade body
This year’s monsoon has been slightly above average, ensuring sufficient rainfall across key cane-producing states. The monsoon has progressed well and is expected to remain active through October. With mills set to start crushing later than usual due to Diwali celebrations, the additional October rains should not impact operations. Sugar production is anticipated to be strong, with post-ethanol diversion output potentially reaching 31.7 Mt. Given domestic consumption of around 29.6 Mt, India could export up to 1.5 Mt.
While the export decision is politically sensitive, current price levels and parity make it viable. At close to 20 cents per pound, the domestic and international markets offer comparable profitability, providing an attractive margin. However, any formal decision on exports will likely come only after stockpiles begin building, with an official announcement expected no earlier than January.
Total Domestic Exports – India (‘000t w/o tolling)

Source: ISMA, Hedgepoint and Indian trade body
Thailand
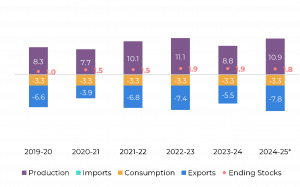
Sugar Balance – Thailand (Dec-Nov Mt)
Source: Thai Sgar Millers, Sugarzone, Hedgepoint
Thailand’s cane crushing season is anticipated to begin in the first half of December. Current market estimates vary widely, between 92 and 110 Mt of cane, with our projection at 102 Mt, driven by yield recovery and a nearly 10% expansion in cane acreage. This shift reflects increased competitiveness of cane over cassava and the positive impact of a strong monsoon on cane growth. As a result, sugar production is expected to approach 11 Mt—still below historical capacity but sufficient to boost exports to around 7.8 Mt, enhancing Thailand’s contribution to the global market.
Total Exports – Thailand (‘000t)

Source: Thai Sgar Millers, Hedgepoint
EU 27+UK
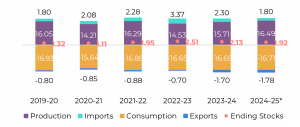
Sugar Balance – EU 27+UK (Oct-Sep Mt)
Source: EC, Greenpool, Hedgepoint
Europe and the UK are key contributors to a weakening white sugar market. The European Commission recently raised its production estimates, directly impacting our outlook as major producers like Germany, Poland, and France anticipate improved output. Favorable weather conditions have supported beet development, with MARS adjusting its sugar beet yield forecasts above the five-year average.
Additionally, the sector has reported a notable increase in planted area. Reports from the UK are also optimistic, indicating increased availability from key white sugar suppliers.
Our current estimate, factoring in ethanol diversion, is that the region will produce 16.5 Mt of sugar. This higher supply is expected to limit the region’s need for imports, reducing its volume from 2.3 Mt in 23/24 to around 1.8 Mt in 24/25. At the same time, exports are likely to remain at the higher end, exerting additional pressure on the white sugar market.
Mexico
Sugar Balance – Mexico (Oct-Sep Mt)

Source: Conadesuca, Greenpool, Hedgepoint
Mexico’s 23/24 crop season ended with a total sugar production of 4.7 Mt. During the year, the country imported 722 kt of sugar, a 4% decrease from the prior year but still above the five-year average of 505 kt. Domestic sugar consumption dropped to 3.4 Mt, and exports plummeted to only 451 kt – nearly 70% below the five-year average and 55% lower than the previous season. Consequently, Mexico’s ending stock surged to 1.4 Mt, marking its highest level in recent history.
This stock level indicates that even with a partial production recovery expected in 24/25, Mexico can increase its participation in the international trade market without risking domestic availability. Therefore, for 24/25 we expect the country to import less (300kt), a similar trend the one observed between 17/18 and 18/19; while exporting close to 900kt.
Total Exports – Mexico (‘000t)

Source: Conadesuca, Greenpool, Hedgepoint
USA
Image 20: Sugar Balance – US (Oct-Sep Mt)

Source: USDA, Hedgepoint
Between September and October, the USDA report showed minimal changes in U.S. sugar production estimates. With increased imports and a larger sugar supply for 2023/24, ending stocks remained elevated at 2 Mt, maintaining a high stock-to-use ratio of 17.6%. Despite a significant drop in Mexico’s share of U.S. sugar imports – from 32% to 13.5% between seasons due to crop failure – the U.S. still imported around 3.5 Mt of sugar. To compensate, the U.S. increased imports from high-duty quota sources like Guatemala.
The USDA also noted production improvements expected for 2024/25, which, combined with higher 2023/24 ending stocks, suggests a reduced reliance on imports going forward. Both cane and beet sugar are expected to improve, however, the latter presents higher growth, close to 4% year-on-year.
Guatemala
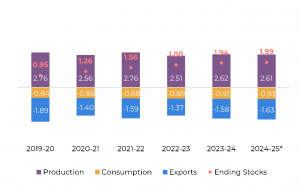
Sugar Balance – Guatemala (Oct-Sep Mt)
Source: Cengicaña, Sieca, Azucar.gt,Greenpool, Hedgepoint
Guatemala’s sugar production for 24/25 is expected to align with or slightly exceed 23/24 levels, as most of the country’s production occurs along the west coast, primarily in Escuintla and Suchitepequez, where rainfall has been above average. Typically, the crushing season starts in early November, but the forecasted higher-than-average rainfall for the period could cause some delays. During the Northern Hemisphere winter, La Niña typically has little effect on the region, so precipitation is likely to remain near seasonal averages, contributing to the cycle’s crushing pace.
In terms of market availability, higher sugar production in Mexico and the U.S. may reduce the need for the U.S. to reallocate its TRQ. Consequently, Guatemalan sugar should be available for other markets in the 24/25 season.
Total Exports – Guatemala (‘000t)

Source: Sieca, Hedgepoint
Ukraine
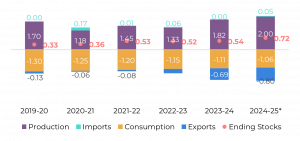
Sugar Balance – Ukraine (Mt Sep-Aug)
Source: Ukrsugar, Sugar.ru, Greenpool, hEDGEpoint
In the 23/24 marketing year (September 2023–August 2024), Ukraine exported 691.8 thousand tons of sugar, with 77% going to EU countries and 23% to other global markets. According to UKRsugar, the primary importers within the EU were Italy (19% of Ukraine’s sugar exports to the EU), Bulgaria (18%), and Hungary (14%). Beyond the EU, major export markets included Cameroon, receiving 17% of Ukraine’s global sugar exports, Libya at 15%, and Turkey at 11%.
Looking ahead, we remain optimistic about Ukraine’s production for the 24/25 season, with a target of 2 Mt. Key regions such as Ternopil and Vinnytsia have already produced 130,000 and 140 thousand tons, respectively. Ternopil, benefiting from favorable weather during beet development, has increased production by 30% compared to last season and is expected to surpass 240 thousand tons. However, oversupply in the market could affect planting decisions for the next season.
Russia
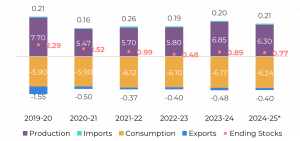
Sugar Balance – Russia (Mt Sep-Aug)
Source: Ikar, Sugar.ru, Greenpool, Hedgepoint
As of October 14, Russia produced nearly 3 Mt of sugar, harvesting 759.7 thousand hectares, which yielded 28.26 Mt of sugar beet. Our expectations remain unchanged, forecasting a lower output of approximately 6.3 Mt, including syrup, due to challenging weather conditions.
According to the Eurasian Sugar Association, as reported by sugar.ru , the region’s total sugar production since the season’s start has reached 3.2 Mt. Russia contributed nearly 3 Mt, while Belarus produced around 198 thousand tons (+24 thousand tons), Kazakhstan 9.3 thousand tons (+4.2 thousand tons), and Kyrgyzstan 12.2 thousand tons (1.25 thousand tons).
China
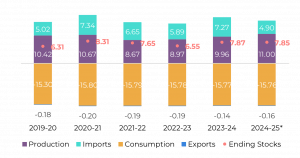
Sugar Balance – China (Oct-Sep Mt)
Source: GSMN, CSA, Refinitiv, Greenpool, Hedgepoint
Obs: stocks also account for bonded warehouses volume and imports include syrup and smuggling estimates
China concluded the 23/24 season with 4.75 Mt of sugar imports and 2.1 Mt of syrup imports. We estimate an additional 350 thousand tons may have entered through smuggling, bringing the total imports to around 7.3 Mt. Combined with domestic production of 9.96 Mt and consumption at 15.7 Mt, this has increased China’s sugar stock to 7.8 Mt, aligning with the 10-year average.
Looking ahead to 24/25, higher domestic production could reduce the need for imports (as such) to 2.7 Mt, assuming stable stock levels and considering price forecasts. China is strategic with its import timing, and with a global trade flow deficit and potential issues in the Center-South crop, the country may exercise caution before committing to new purchases. China is also capitalizing on the syrup market, a trend likely to continue. We estimate close to 2Mt of syrup being imported next season.
In terms of production, Guangxi is receiving ample rain and may anticipate its crushing start, around early November, due to increased cane output. Yunnan has also enjoyed favorable, sunny weather recently and is expected to surpass last season’s production.
Total Imports – China (‘000t – exc. syrup and smuggling)

Source: GSMM, Hedgepoint
Total Production – China (‘000t)

Source: CSA, Refinitiv, Greenpool, Hedgepoint
Content and commentary produced by Livea Coda. She is market intelligence coordinator at Hedgepoint Global Markets
Continue reading Chinimandi.com for more news about the Sugar and Allied Sectors.


